Health & Monitoring
Kaleido environments surface a rich suite of health and monitoring metrics for granular insights into your resource stack's health and performance and underlying blockchain.
From the lefthand navigation within your environment, expand the Health & Monitoring tab to display the available categories.
Dashboard
Displays the CPU, Memory, and Disk Consumption of environmental resources.
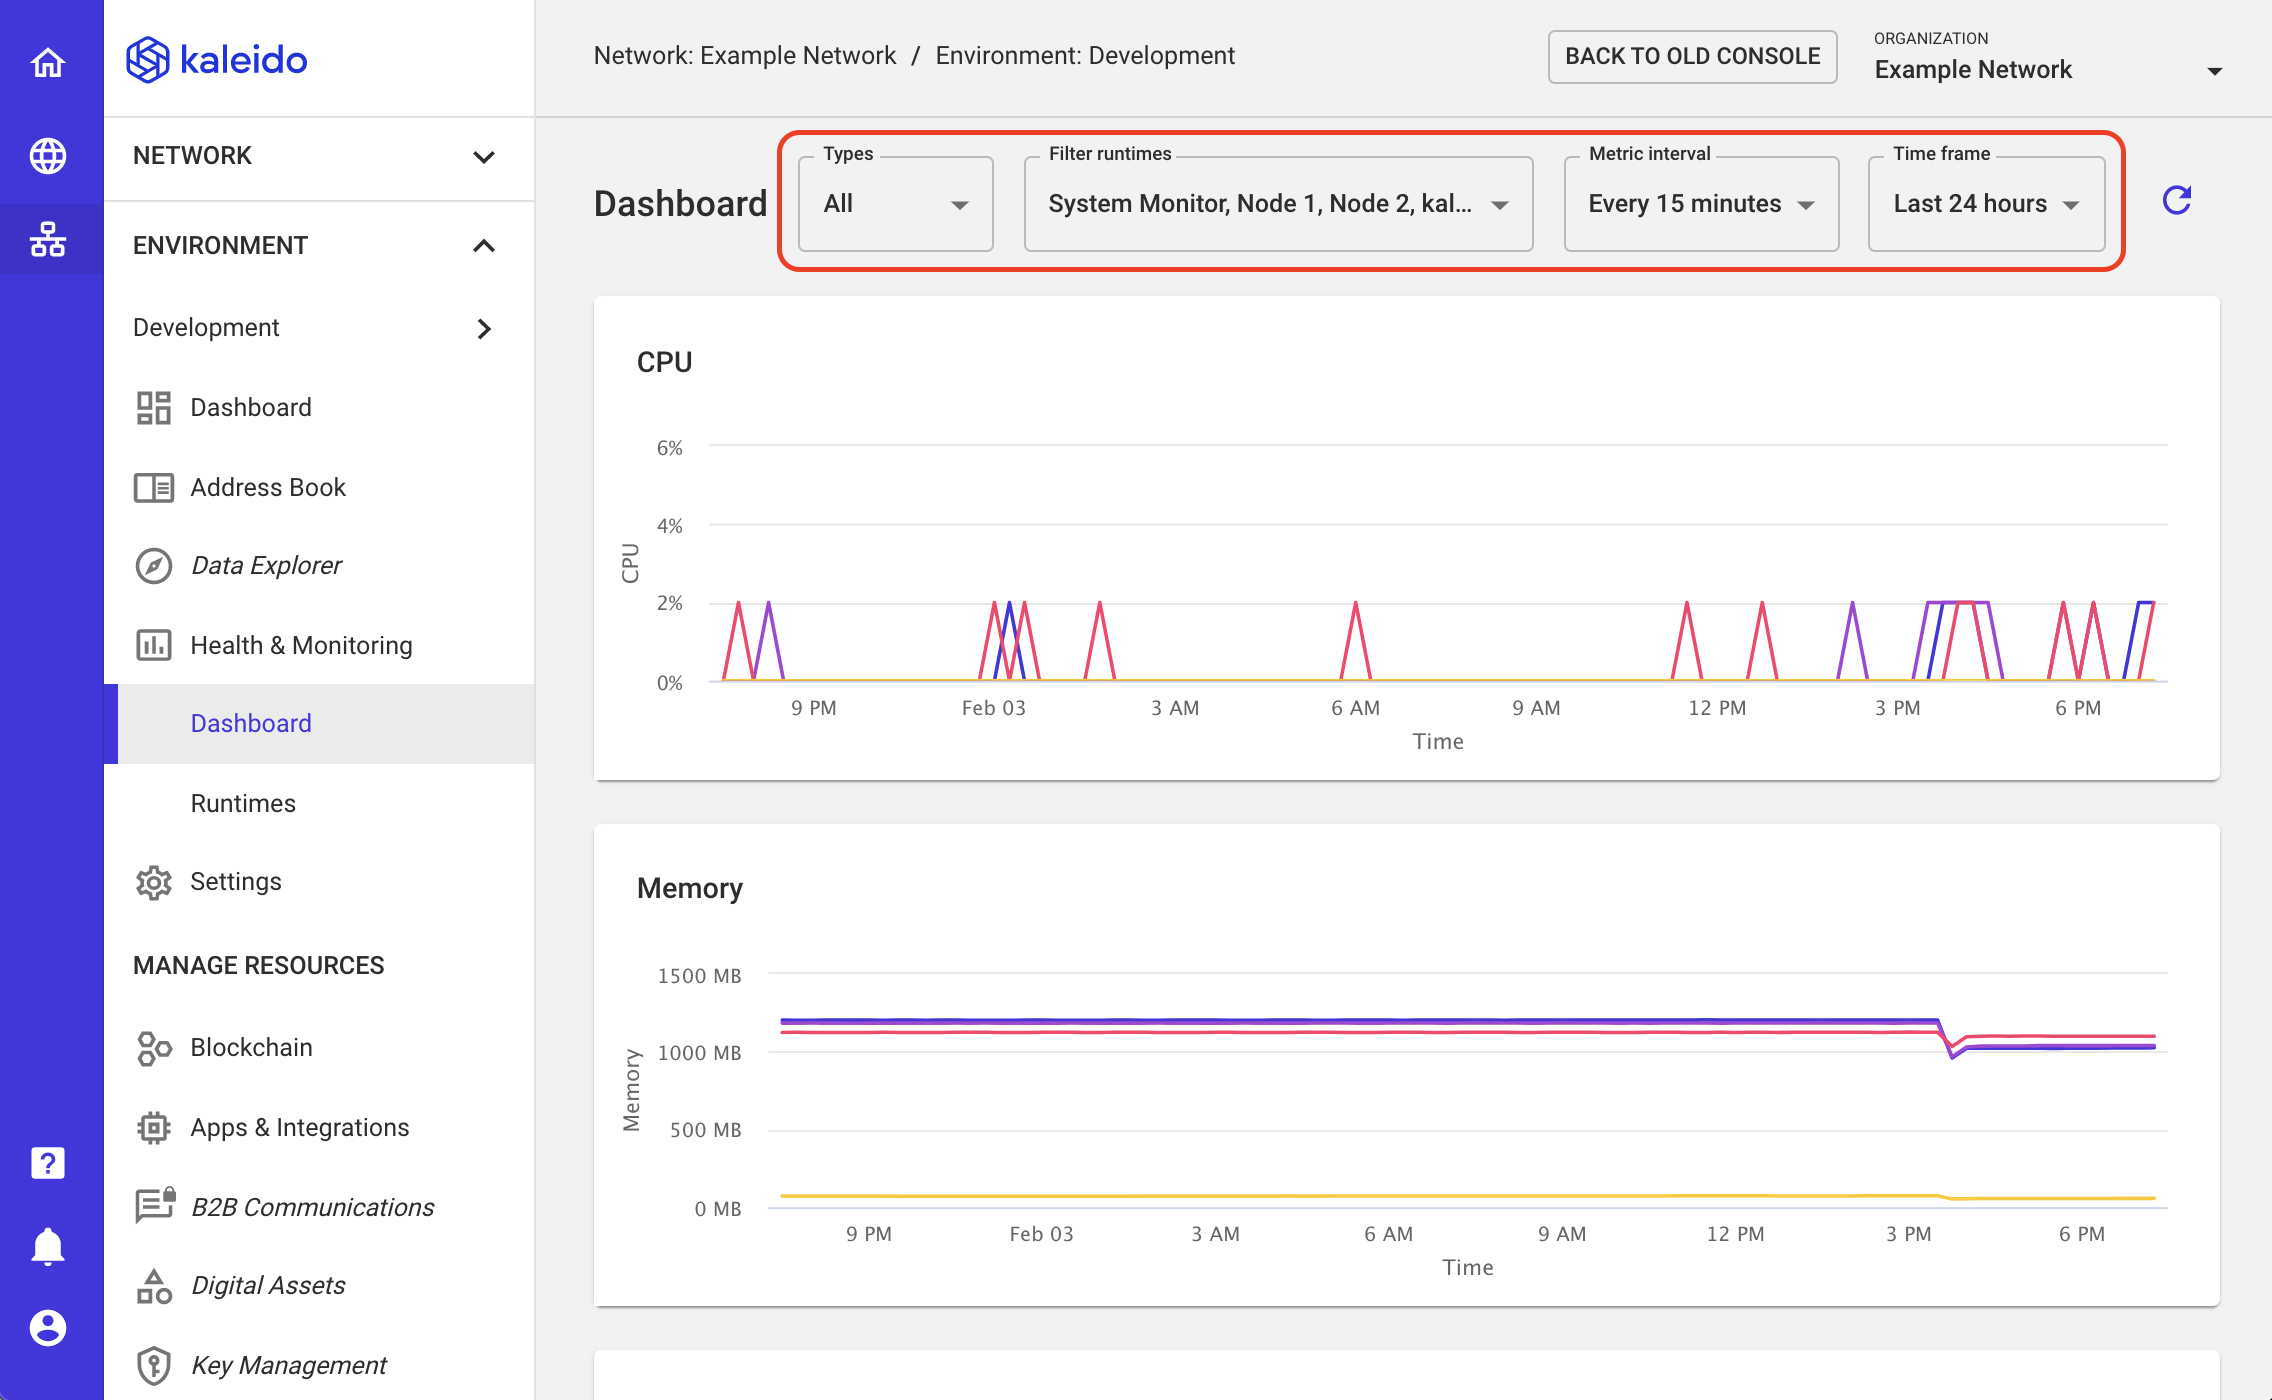
Take note of the dropdown menus at the top of the screen. They provide you with customizable parameters to filter amongst relevant details to your organization and overall network.
- Types - The types of resources you wish to view. Choose between
ALLor enumerate a specific service type. - Runtimes - The specific runtimes you wish to see metrics for.
- Metric Interval - The display interval for the underlying metrics. Choose between 5, 15, 30, 45, or 60 minute intervals.
- Time Frame - The overall window you wish to see metrics for.
Runtimes
Provides information about the following metrics for one or more runtimes. Use the dropdown menus at the top of the screen to filter amongst types and specific runtimes.
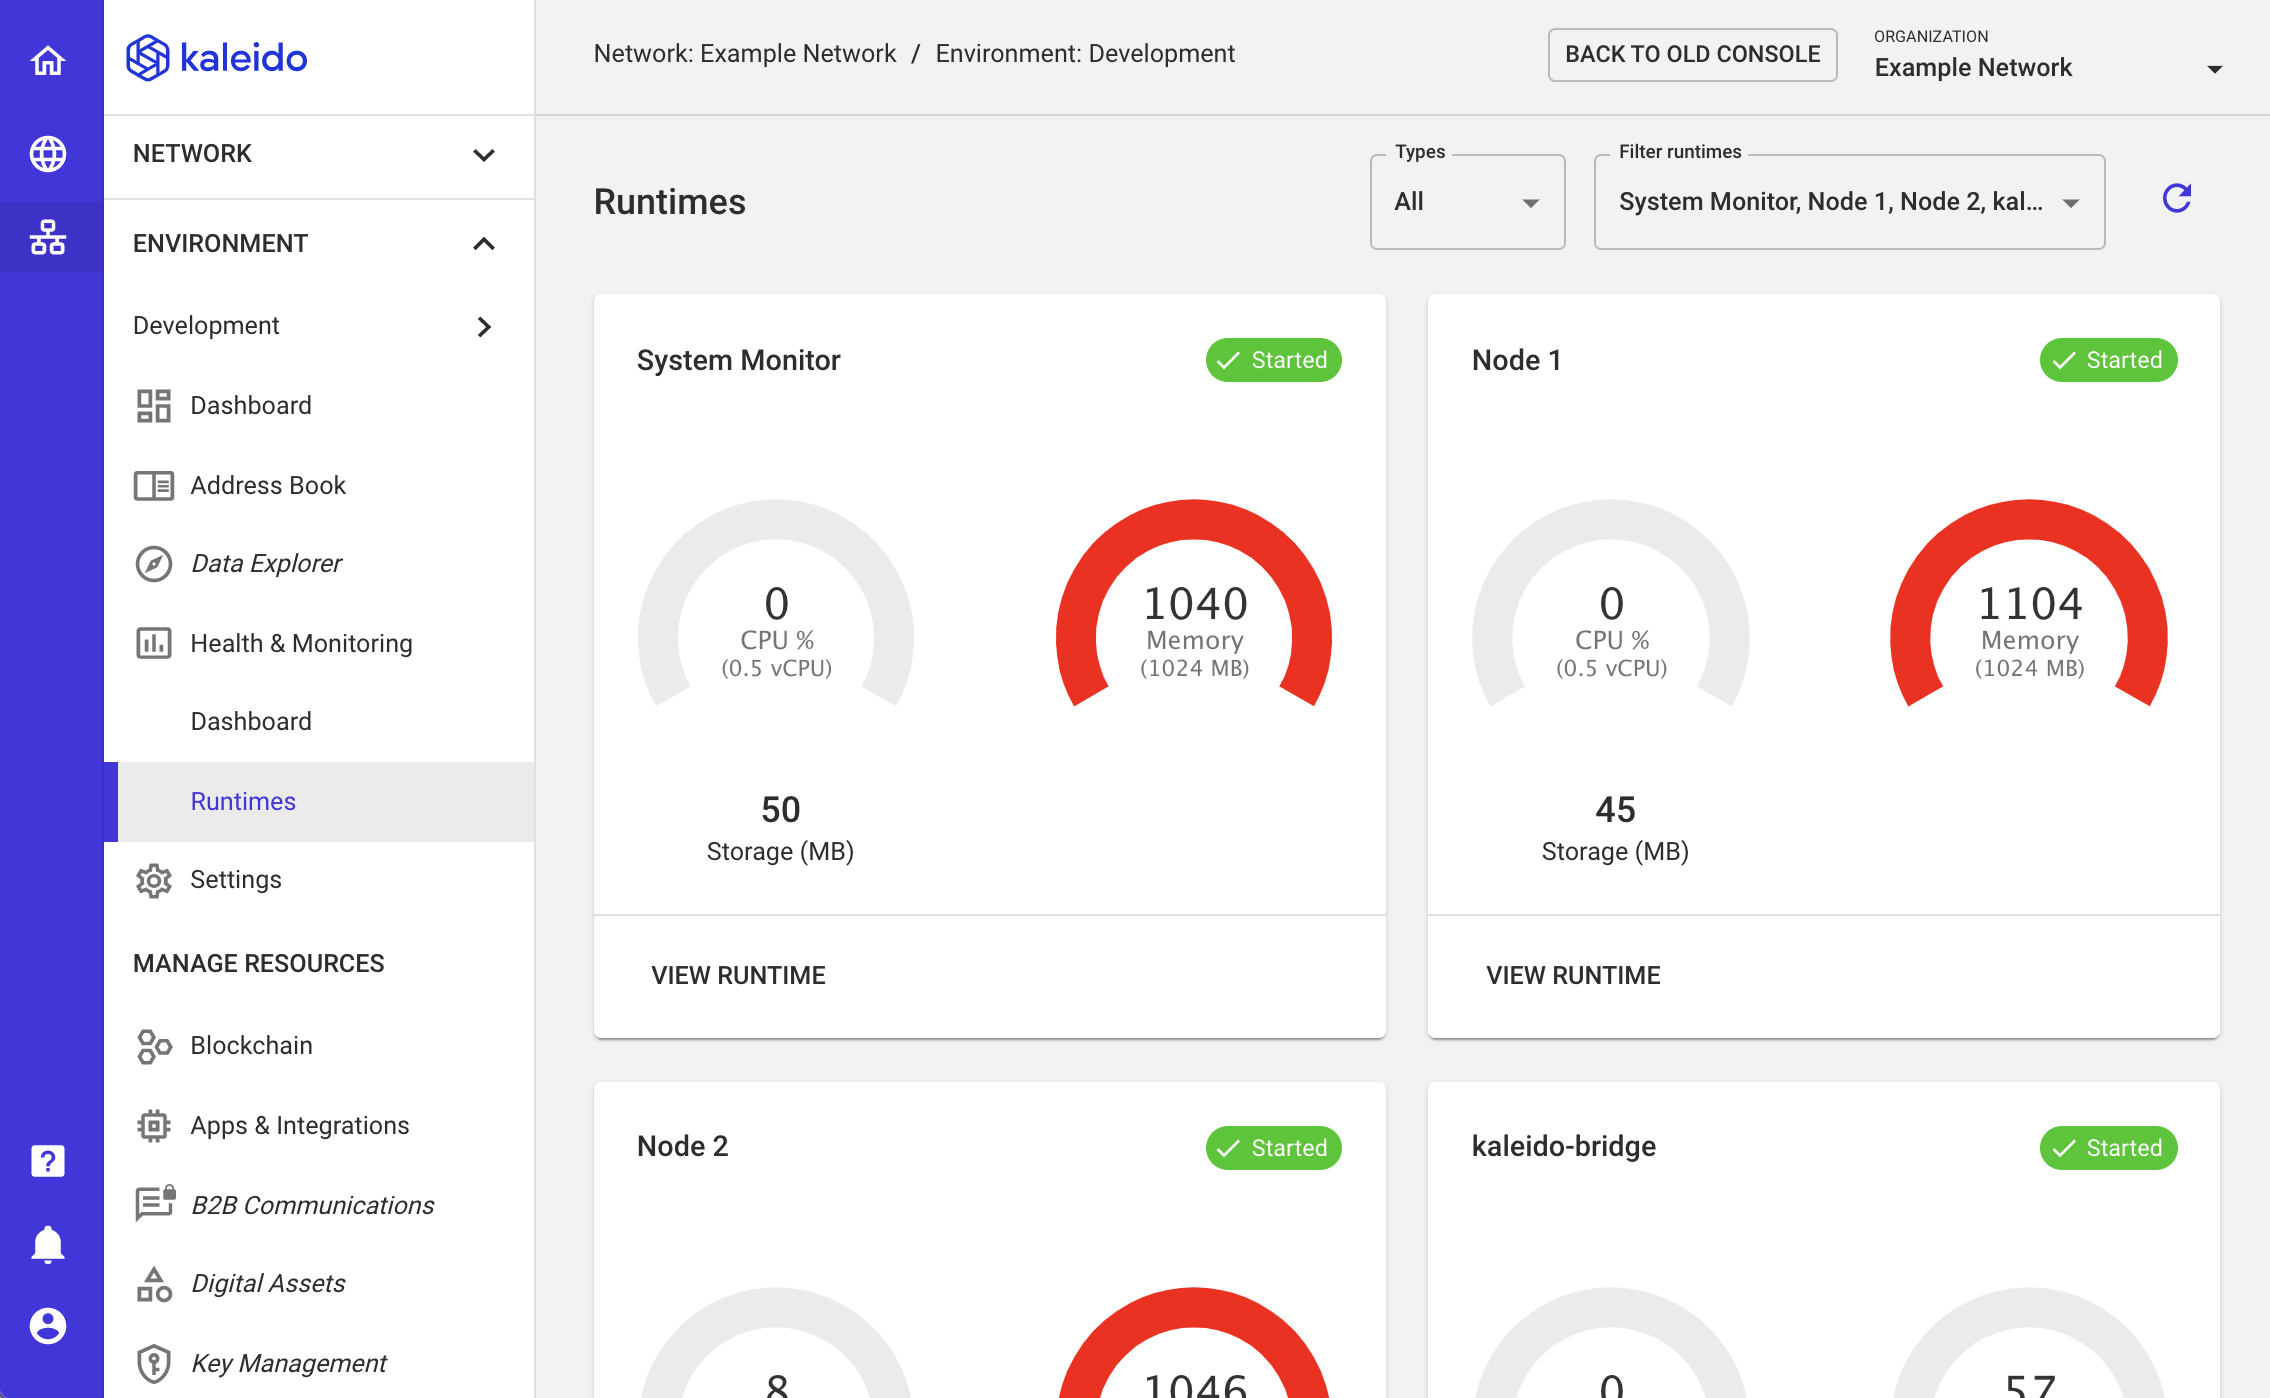
- CPU Utilization - Average CPU utilization (%) over time.
- Memory Utilization - Memory Utilization (MB) over time.
- Peer Count - This represents the number of other nodes in the chain that a node is directly connected to.
- Storage - Total disk usage from data generated by the node (levelDB chain/state information and logs).
Click the VIEW RUNTIME button beneath a resource to see additional details.
Blockchain
Provides time-based filterable information about your blockchain layer.
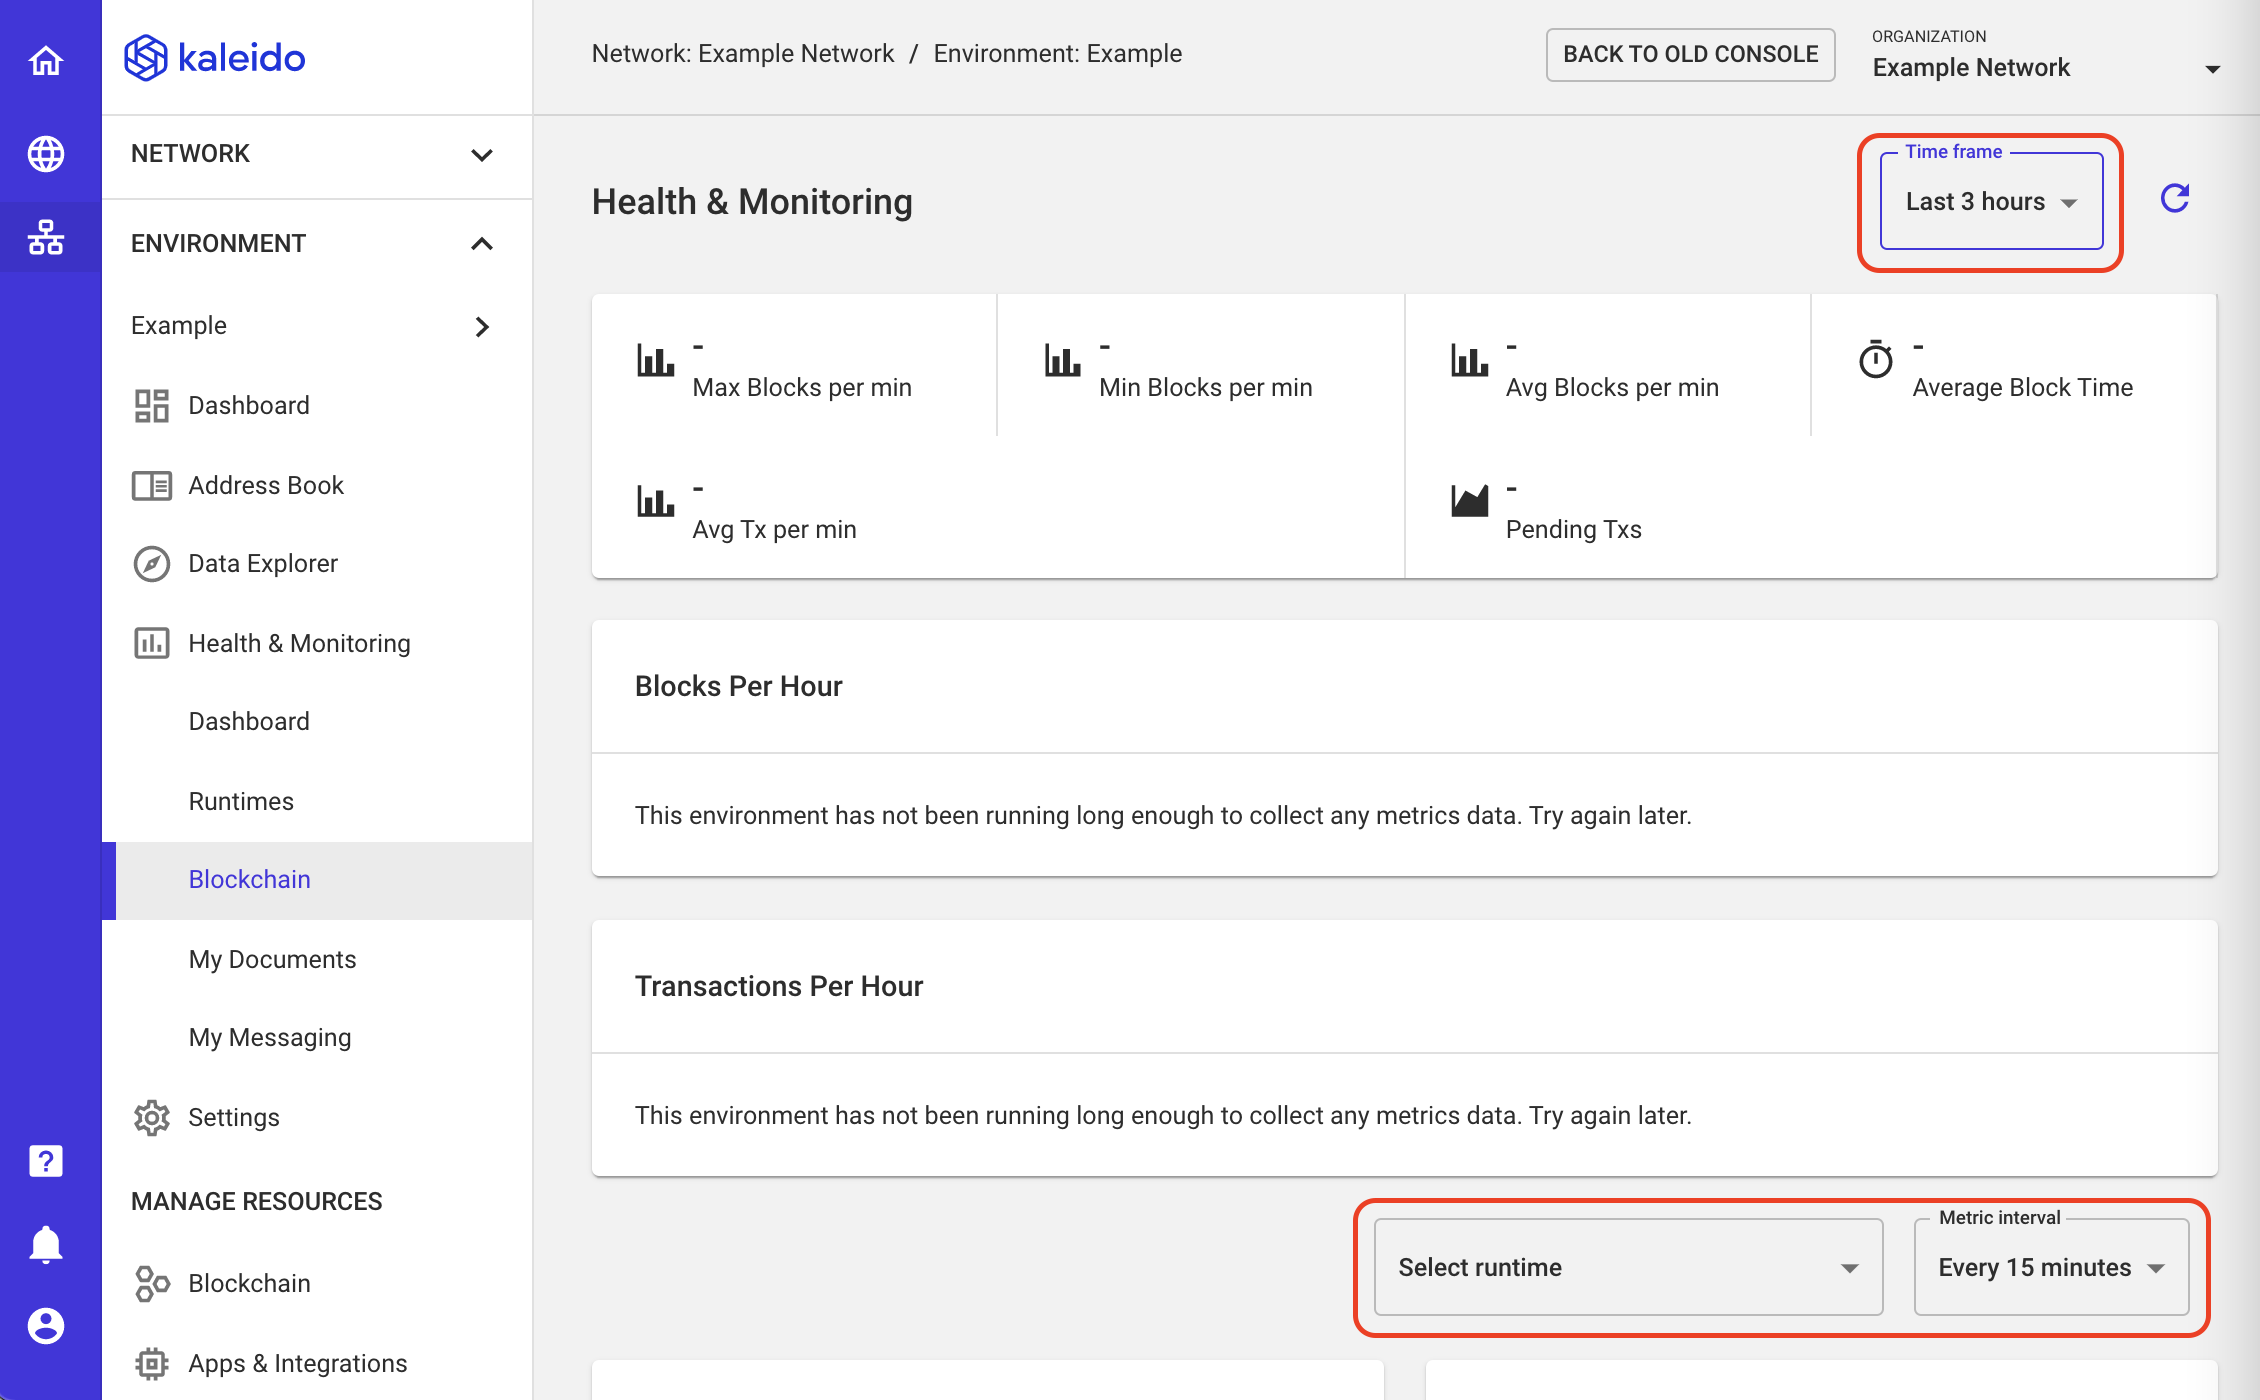
The metrics include:
- Max Blocks per minute
- Min Blocks per minute
- Avg Blocks per minute
- Avg Block Time
- Avg Transaction per minute
- Pending Transactions
- Blocks per hour
- Transactions per hour (toggle between public, private, or all transactions)
The lower portion of the panel provides blockchain-based information specific to your nodes. Use the dropdown windows to customize the displayed runtimes and intervals. The graphs display:
- Pending Transactions - properly signed and submitted transactions waiting to be processed; can occur if the
targetGasLimitfor the block has been reached before the transaction can be executed; or if there is an unavailable CPU available to mine the transaction during the current block period. - Queued Transactions - transactions in a node's memory pool but cannot be processed due to nonce mismanagement or a preceding transaction being dropped from the queue.
- Peers - the number of peers each node is connected to via P2P.
- Block height - current block height for the chain.
Note that a healthy environment will show an increasing block height over time (except if the consensus protocol is RAFT, in which case blocks are only produced on demand - when transactions are mined) and nodes that have peer connections to all other nodes in the chain.
My Documents & Messages
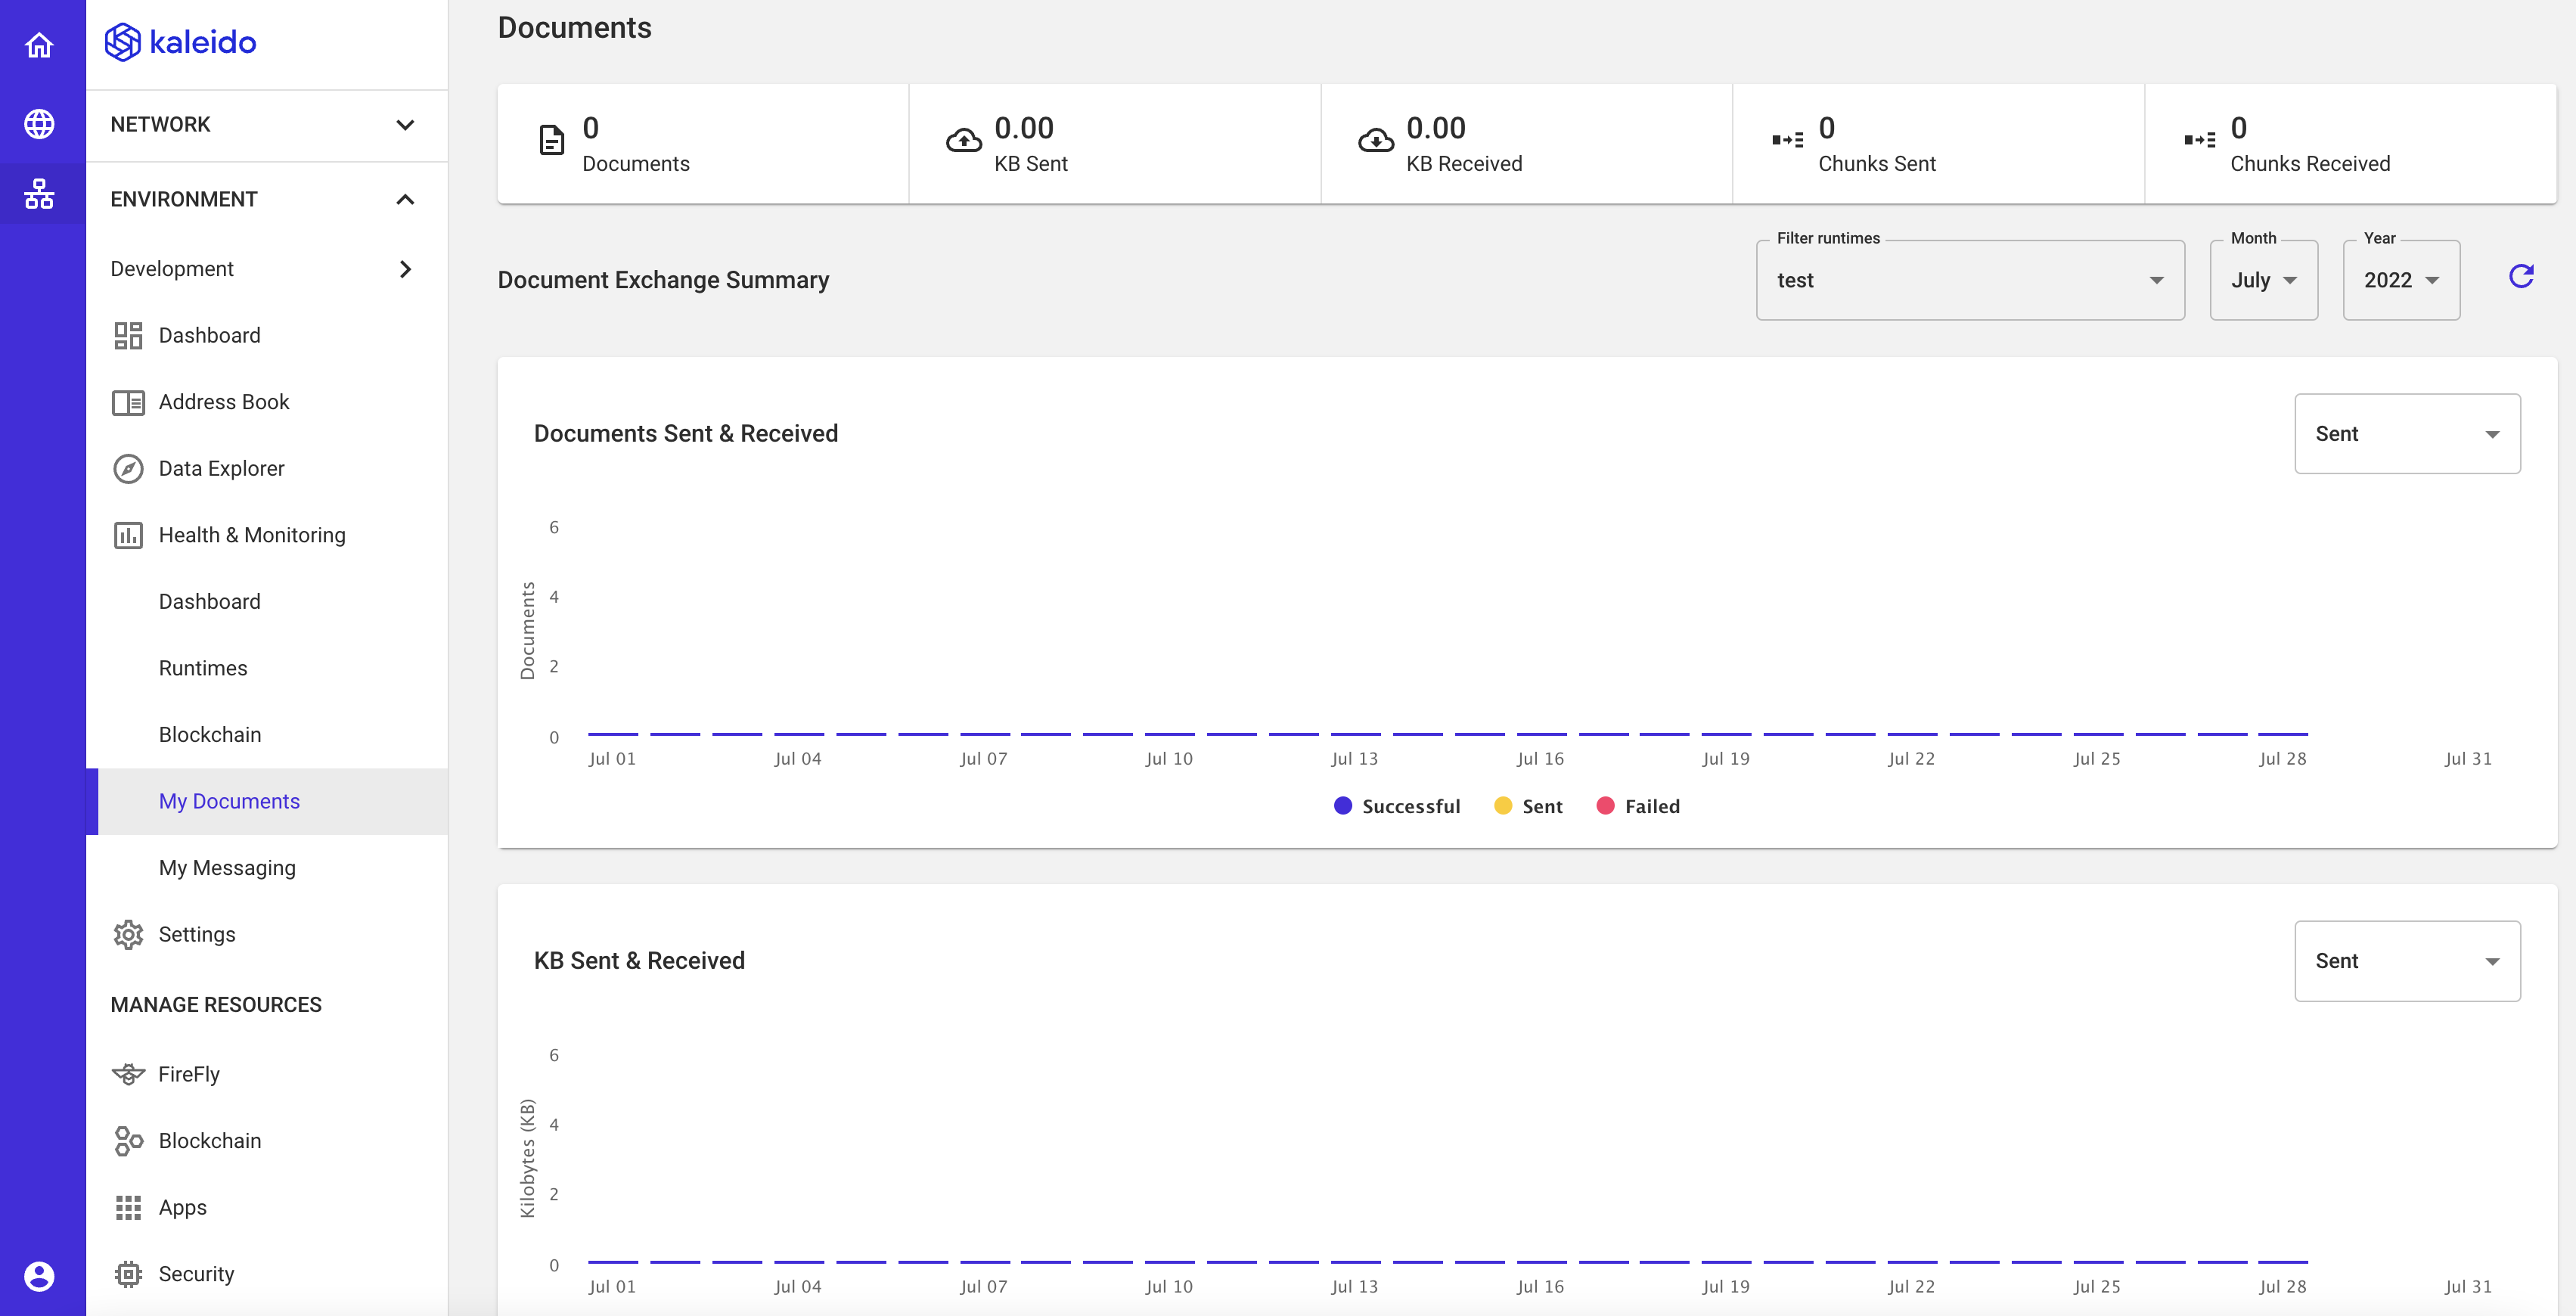
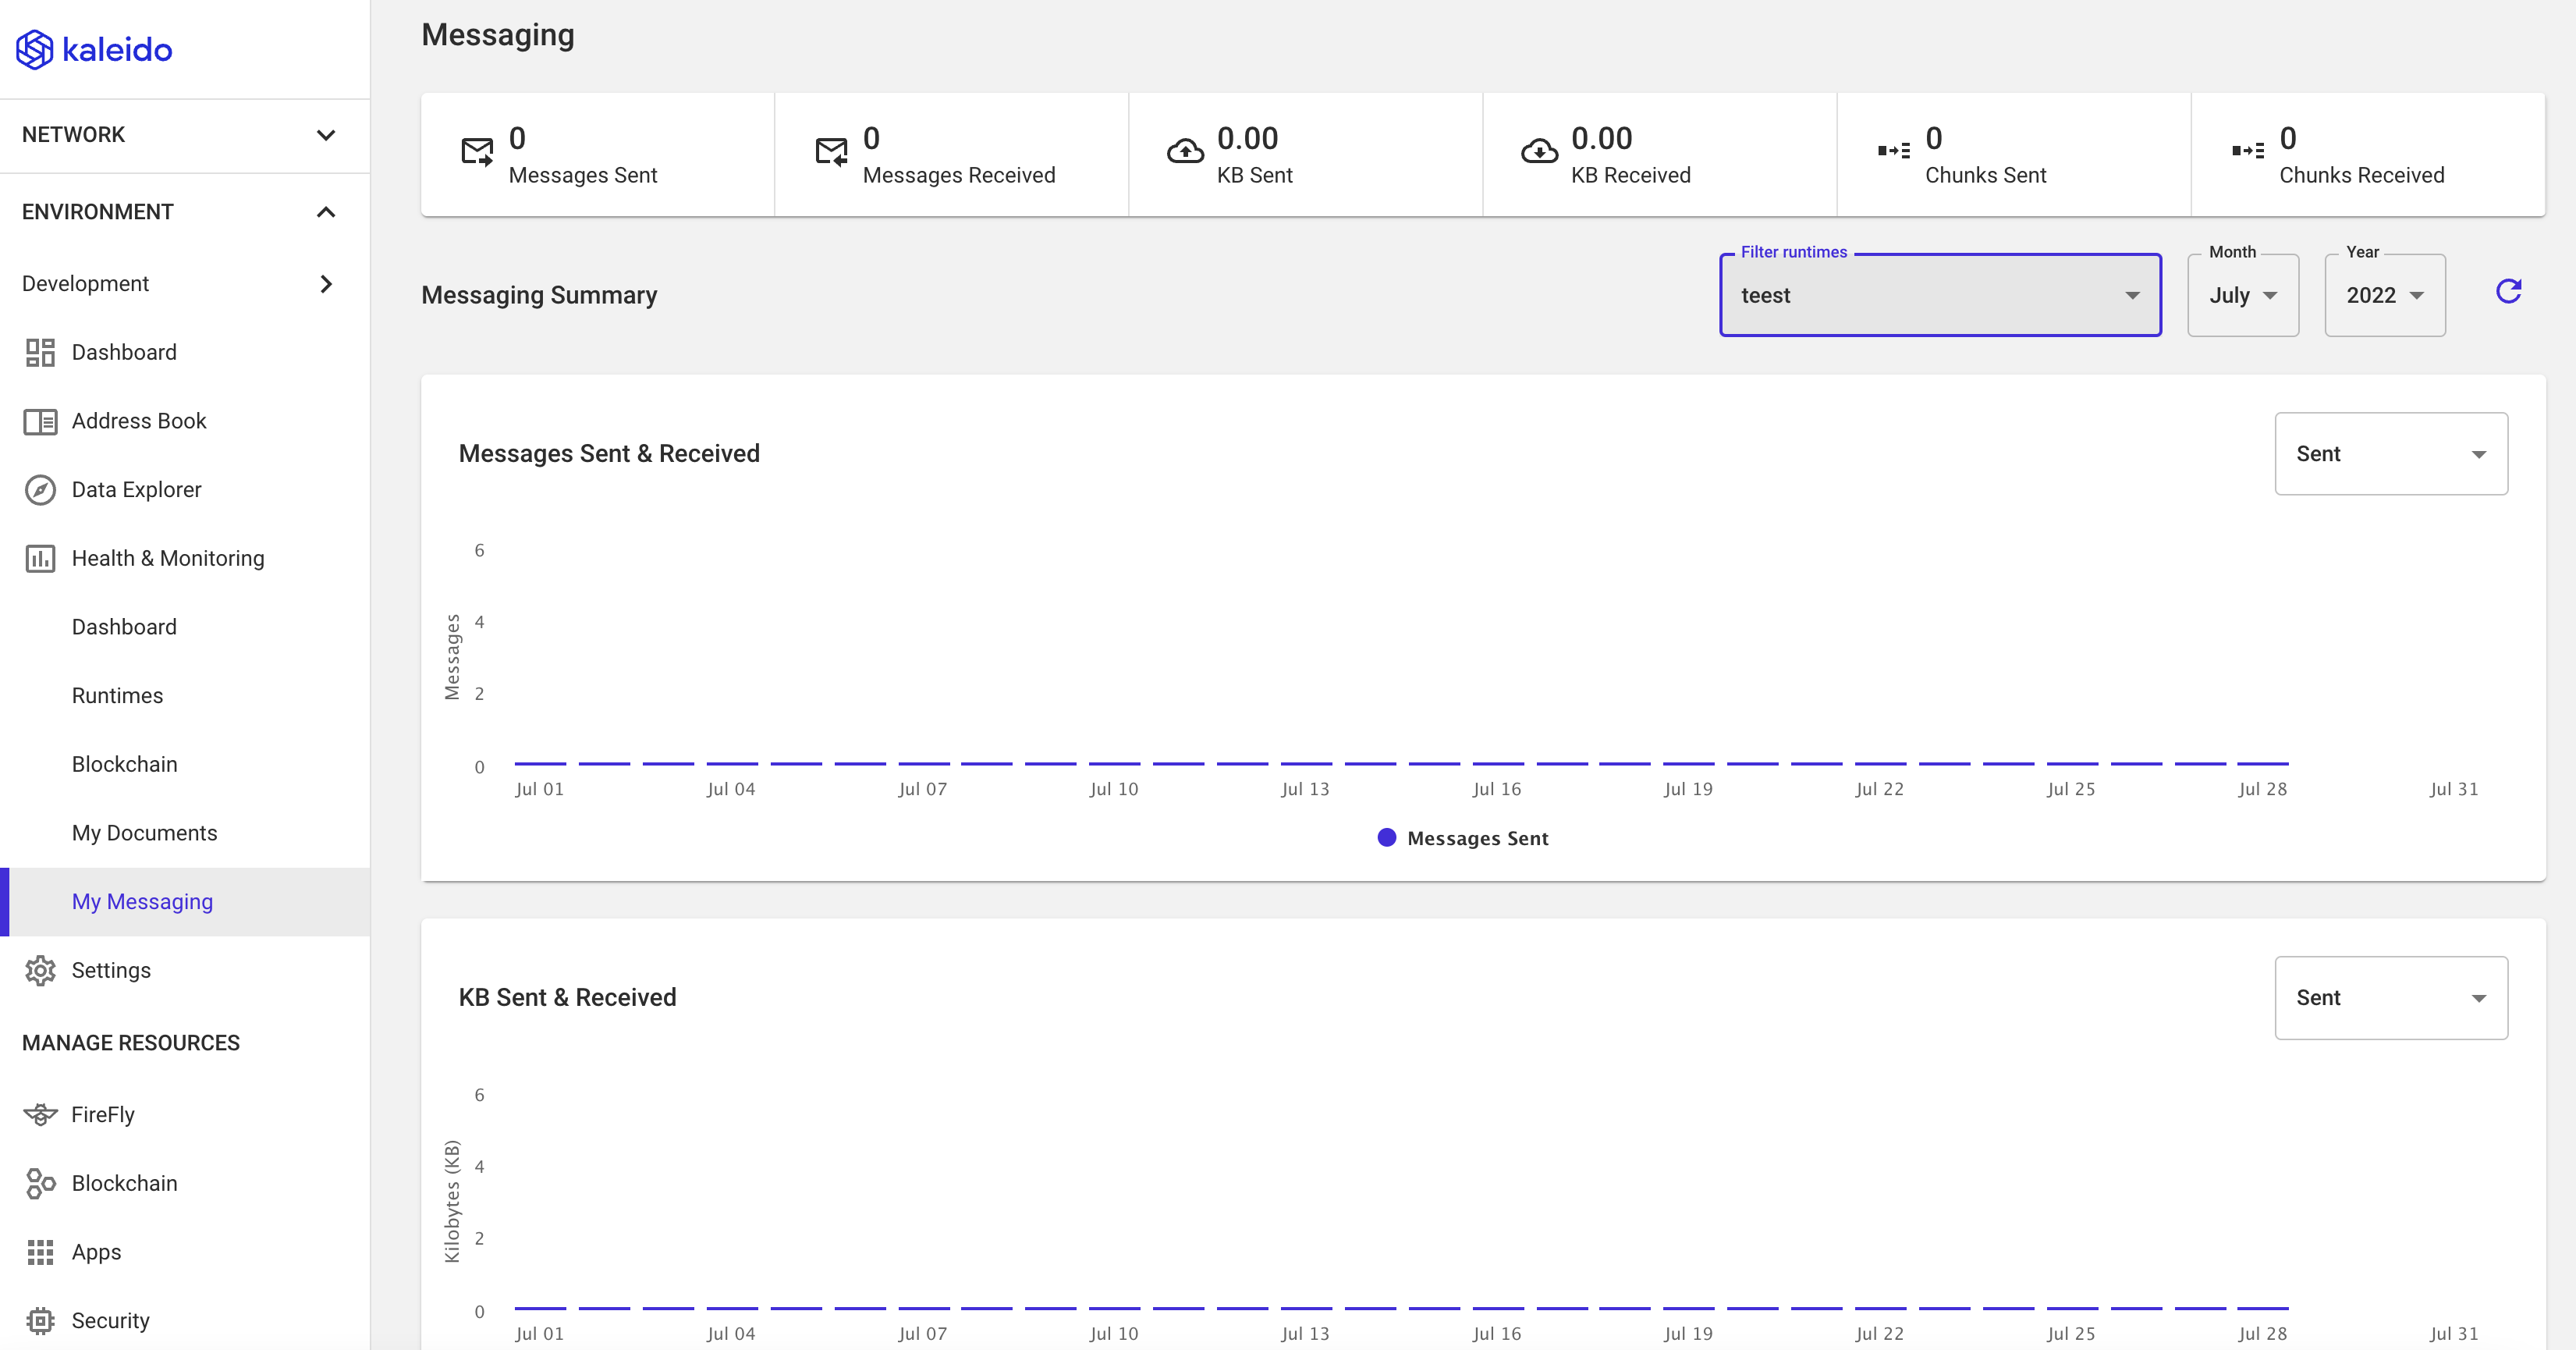
Provides tracking information on the number and size of documents/messages sent and received, as well as the number of documents in storage. Filtering for specific runtimes and date ranges is available in the top right.
